Read your dashboard and analytics
You know what needs your attention today and how your store is doing over time.
All numbers are live and only ever about your store. Days follow Pakistan time.
Dashboard: what needs your attention
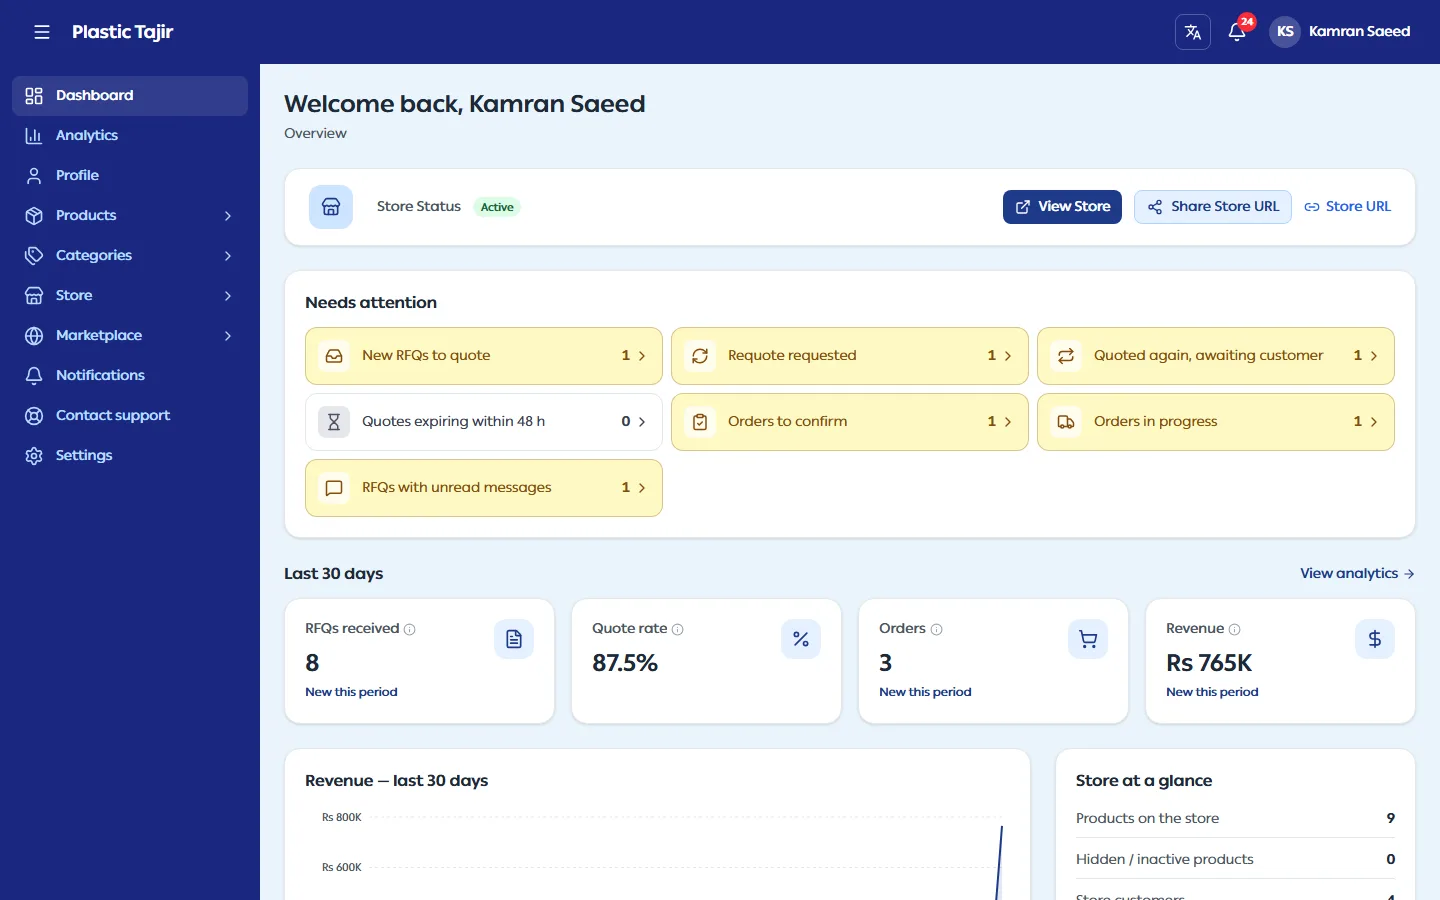
Dashboard opens with Needs attention. Each box is a count; click it to open the matching list:
| Box | Opens |
|---|---|
| New RFQs to quote | Store → RFQs, filtered to New |
| Requote requested | RFQs where the customer asked for a new price |
| Quoted again | RFQs where you sent a new quotation after a rejection or a requote request, waiting for the customer |
| Quotes expiring within 48 h | Quoted RFQs whose quotation ends soon |
| Orders to confirm / Orders in progress | Store → Orders, filtered |
| RFQs with unread messages | Your RFQs (open one to read the new message) |
Unread notifications are counted on the bell in the top header, not here.
Below it, Last 30 days shows RFQs received, quote rate, orders and revenue, each with the change against the 30 days before (for example +50% vs previous period, or New this period when there was nothing before). Store at a glance shows your products, store customers, orders waiting for confirmation and revenue to date, and Recent RFQs lists the latest five.
Analytics: how the store is doing
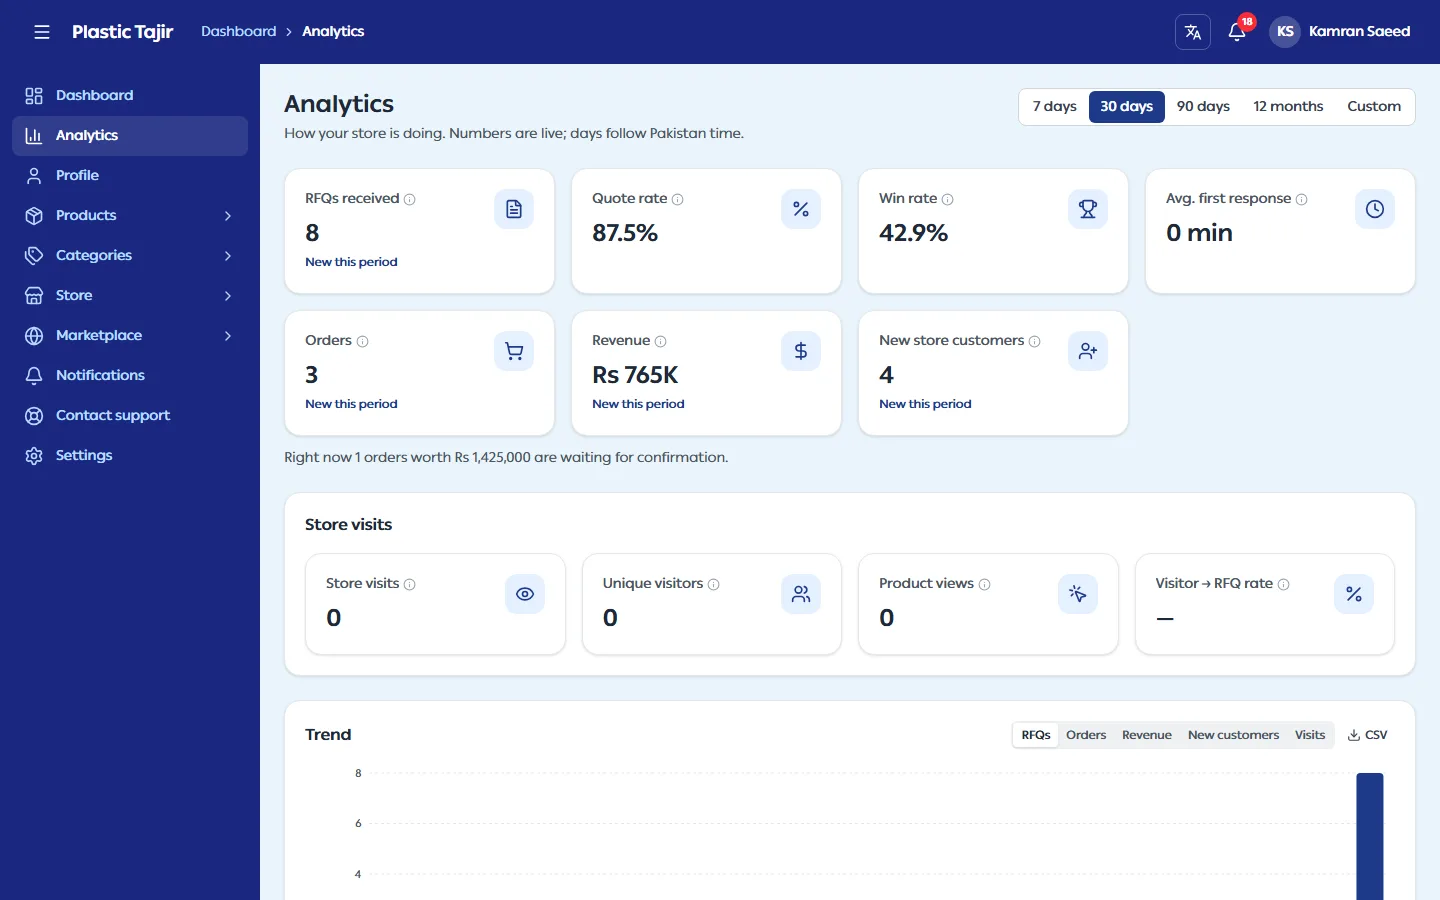
Open Analytics and pick a period at the top right: 7 days, 30 days, 90 days, 12 months or Custom (up to 24 months). The period stays in the page address, so you can bookmark or share it.
| Section | What it tells you |
|---|---|
| Key numbers | RFQs received, quote rate (share of RFQs you quoted), win rate (share of quoted RFQs that became an order), average first response time (lower is better), orders, revenue, new store customers. Hover the ⓘ for the exact meaning. |
| Store visits | Visits, unique visitors, product views and the visitor → RFQ rate. Visits are counted anonymously; your own visits while logged in to the CMS are not counted. |
| Trend | A chart of RFQs, orders, revenue, new customers or visits over the period. |
| RFQ funnel | How many RFQs were quoted, ordered and completed, plus requote and expiry rates. |
| Top products / Top customers / RFQs by city | Your best products (by RFQs, orders or revenue), customers by revenue, and where deliveries go. |
Revenue counts orders you have confirmed (confirmed, in progress or completed). Orders still waiting for your confirmation are shown separately.
Export to Excel
Every chart and list has a CSV button. It downloads exactly what you see, for the chosen period; Excel opens it with Urdu names intact.
Troubleshooting
| Problem | What to do |
|---|---|
| Everything is greyed out | Your account is still pending approval. (A suspended store's numbers stay visible.) |
| A box says Couldn't load this | Click Retry; the rest of the page keeps working. |
| No data for this period yet | Pick a longer period. |